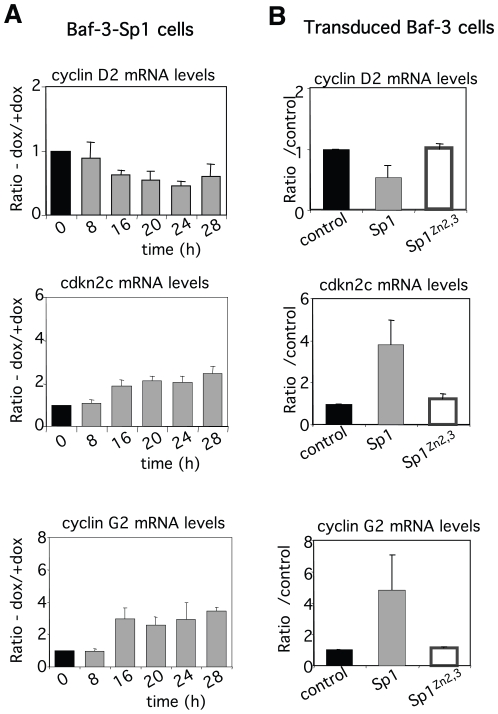
Figure 6. Changes in expression profile of cyclin D2, cdkn2c/p18 and cyclin G2.
mRNA levels of cyclin D2, cdkn2c and cyclin G2 in Baf-3-Sp1 clone 1 (A) or in Baf-3 cells transduced with control, Sp1 and Sp1Zn2,3 encoding retroviruses (B) were measured by real-time PCR as indicated in figure 3. Results show the ratio of the mRNA levels measured in Sp1-overexpressing cells relative to mRNA levels measured in control cells and show the means of ± sd of at least 2 independent experiments.

