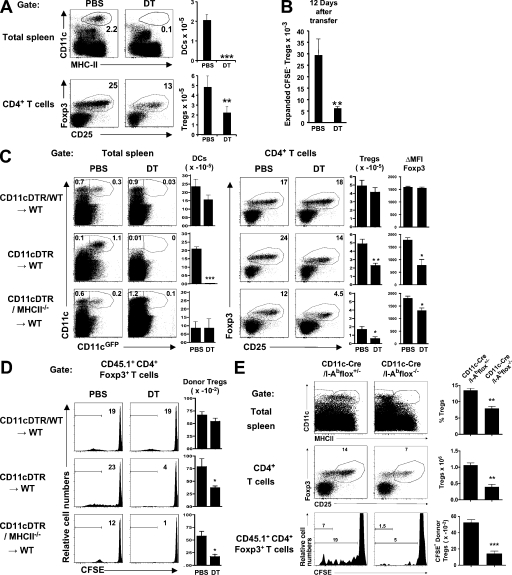
Figure 2.
MHCII expression by DC is required to maintain T reg cell homeostasis. (A) Dot plots show CD11c versus MHCII (top) and Foxp3 versus CD25 (bottom) staining in the spleens of CD11cDTR→WT chimeric mice after treatment with PBS or DT. Histograms show the means ± SD of the absolute number of endogenous DCs and T reg cells in spleens measured 12 d after PBS or DT treatment (n = 6 mice in one representative out of five experiments). (B) Histogram shows the mean numbers ± SD of CFSE-labeled transferred T reg cells that underwent more than five divisions in the spleens of the CD11-DTR chimeras shown in A at the indicated time points after transfer (n = 3 mice for each condition in five experiments). (C) Dot plots show endogenous DCs and T reg cells in the spleens of the indicated chimeric mice treated with PBS or DT for 6 d. Histograms summarize the number of endogenous DCs and T reg cells ± SD, and the Foxp3 intensity of expression in T reg cells as measured by the mean fluorescence index difference (ΔMFI) between T reg and CD4+Foxp3− cells ± SD (n = 2–3 mice per group in three experiments). (D) Histograms (left) show representative examples of day 7 CFSE dye dilution by transferred allotype-marked T reg cells in the experiments shown in C. Histograms (right) summarize the number of transferred CFSE-labeled T reg cells found in the spleens of the same mice (n = 2–3 mice in three experiments). (E) DCs (top) and T reg cells (middle) in the spleens of CD11c-Cre/I-Abflox+/− and CD11c-Cre/I-Abflox−/− mice, and CFSE dye dilution by allotype-marked T reg cells after 7 d (bottom). Percentages and absolute numbers of endogenous T reg cells and CFSE− donor T reg cells ± SEM are indicated (n = 3 mice per group). One representative out of two experiments is shown. p-values were determined by a Student's t test comparing the experimental group versus control. *, P < 0.05; **, P < 0.01; ***, P < 0.001.

