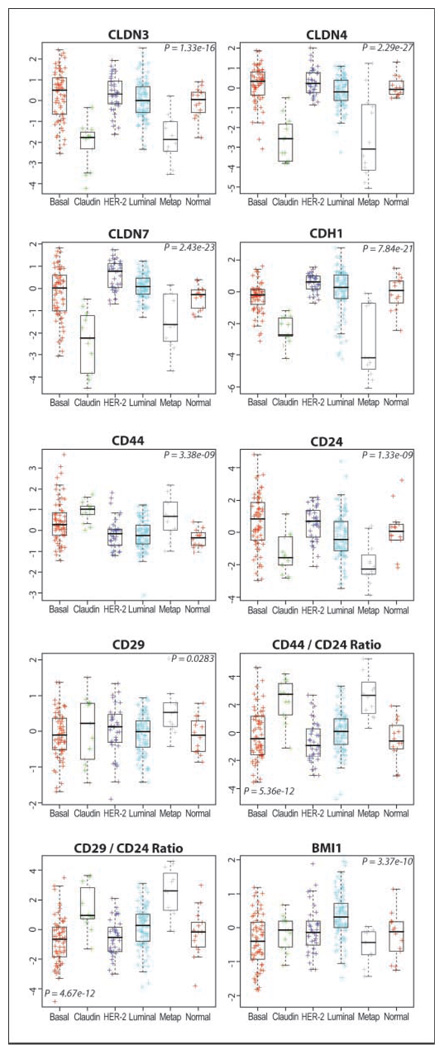
Figure 3.
Expression of claudin-low and stem cell markers in breast cancer subgroups. Using data from transcriptional profiling, metaplastic (Metap) and claudin-low tumors express low levels of claudins CLDN3, CLDN4, and CLDN7 of CDH1 (E-cadherin) and high CD44/CD24 and CD29/CD24 ratios. P values (ANOVA). P values for the metaplastic-basal comparison of stem cell markers were 0.41 (BMI1), 0.19 (CD44), 0.004 (CD29), 0.00009 (CD24), 0.00006 (CD44/CD24 ratio), and 0.00007 (CD29/CD24 ratio).

