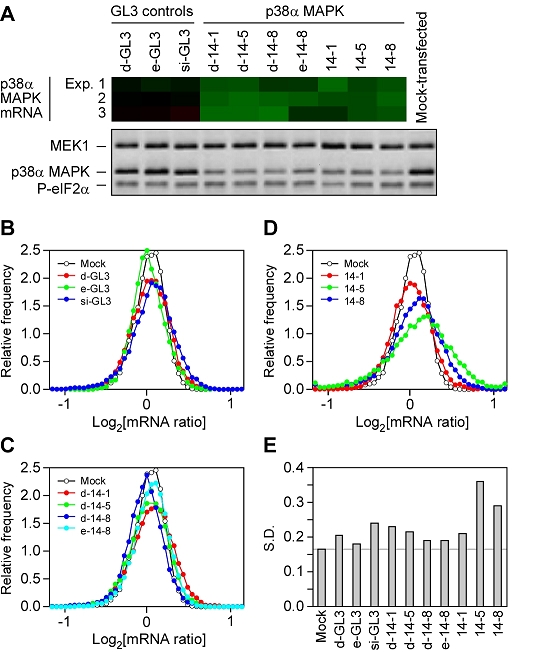
Figure 3.

Global changes in gene expression in siRNA-treated cells. (A) Decreases in p38α MAPK mRNA and protein levels. mRNA levels were measured by microarray analysis and data from three experiments are shown. Protein levels were also assessed in triplicate; one representative blot, showing p38α MAPK levels, MEK1 levels, and eIF2α phosphorylation, is shown here. (B-D) Distributions of mRNA levels. (E) Standard deviations of the mRNA distributions.
