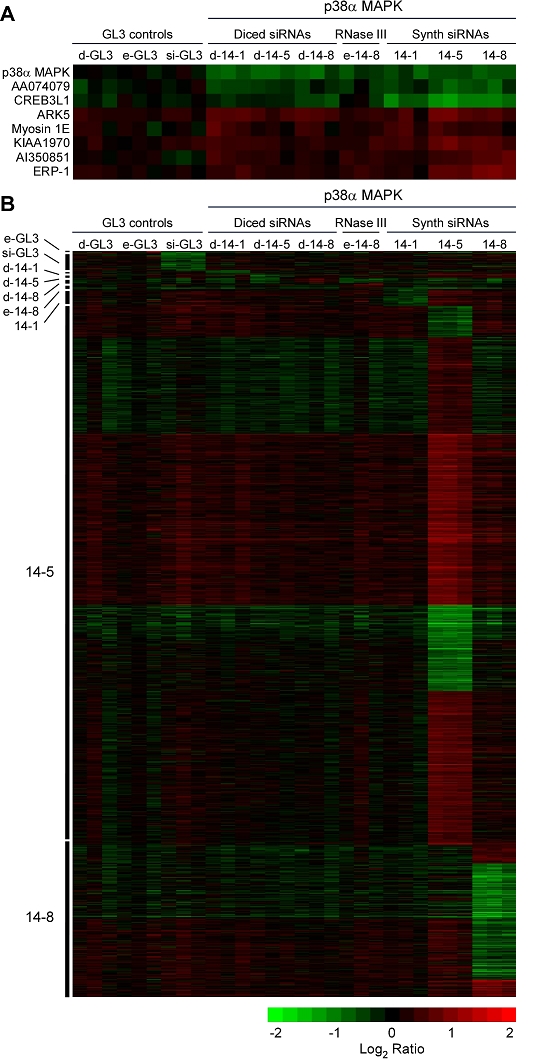
Figure 4.

Secondary and off-target effects in cells treated with siRNAs, d-siRNAs, and e-siRNAs. Cells were transfected with various siRNAs and pools at a final concentration of 10 nM and were subjected to microarray analysis. (A) Putative secondary effects. The samples whose p38α MAPK mRNA was suppressed were compared to the GL3 control samples by significance analysis of microarrays (SAM) (Tusher et al, 2001) in order to identify mRNAs whose expression is regulated by p38α MAPK. (B) Off-target effects. Ten SAM analyses were carried out, comparing each of the treatments (3 experiments) to the other nine (27 experiments). No significant mRNA changes were detected for one of the treatments (d-GL3). For the other treatments, the mRNAs that changed significantly are represented as heat maps. The treatment to which each heat map corresponds is indicated on the left; for example, the comparison of e-GL3 to the other treatments is shown at the top, and the largest heat map compares the 14-5-treatment to the others. Within each heat map, the mRNAs are organized by clustering.
