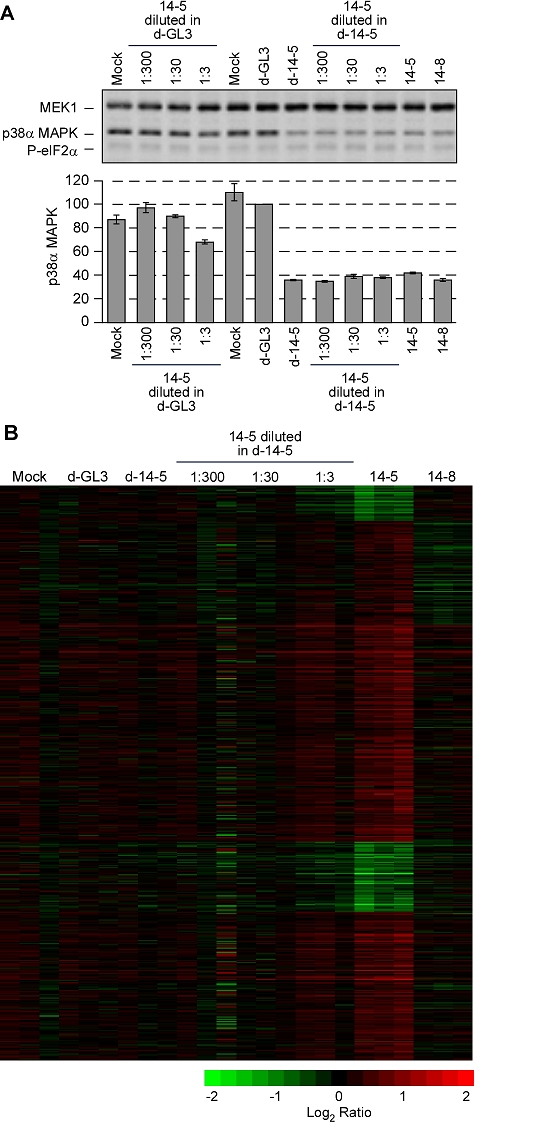
Figure 5.

Off-target effects are titratable. (A) Changes in p38α MAPK protein levels. HeLa cells were transfected in triplicate with the siRNAs and pools shown, all at a final concentration of 10 nM. One representative immunoblot, showing MEK1 levels (loading control), p38α MAPK levels, and eIF2α phosphorylation is shown along with quantitative p38α MAPK data from all three replicates. Data are plotted as means ± S.D. (B) Fluorescence intensity data from the microarray experiments. The 1105 mRNAs identified as changing significantly in the SAM analysis of 14-5 vs. the other treatments (shown in Figure 4B) were used for the heat map shown here. Genes that were not well-measured in one or more samples are omitted from the heat map.
