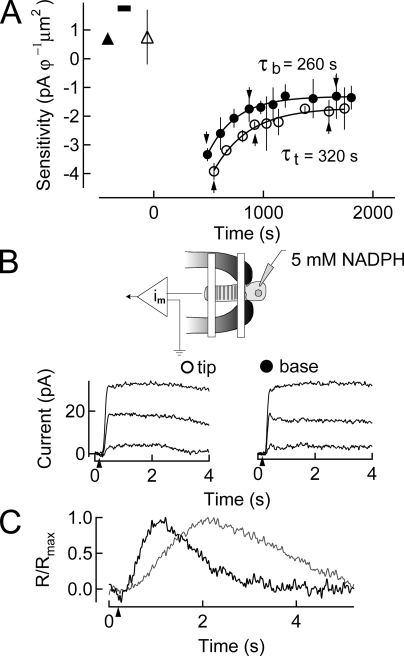
Figure 3.
Dialysis of 5 mM NADPH into rods before a 50% bleach of the visual pigment. (A) Changes in log sensitivity before and after pigment bleaching were plotted as a function of time. Sensitivity before (upward filled triangle) and after (upward open triangle) dialysis with internal solution containing 5 mM NADPH (black bar) is plotted (mean ± SEM). A 50% bleach was given at time 0 s. Recovery at the base and tip of the outer segment commenced earlier in time than in Fig. 2, with a time constant at the base of the outer segment of ∼260 s, and at the tip of the outer segment of ∼320 s. (B) Suction electrode configuration while dialyzing 5 mM NADPH into the rod inner segment. Lower superimposed traces show responses to saturating flashes at selected time points during recovery in A. (C) Dim flash responses in the dark-adapted cell after dialysis (gray) and at steady state after pigment bleaching (black) indicating the response speeding characteristic of bleaching adaptation.

