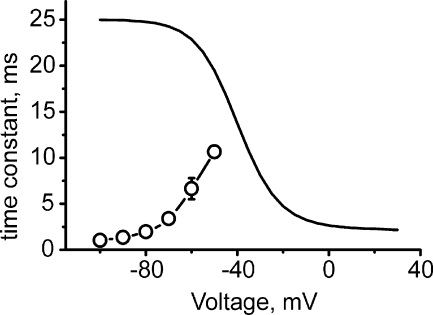
Figure 7.
Voltage dependence of deactivation time constants predicted by fitting the data for mutant I781T to the backward activation pathway: Deactivation time constant (solid line) was calculated by Eq. 2.2 (rate constants are indicated in Tables II and III). The model predicts an increase of the deactivation time constants, whereas the experimentally measured time constants decreased with increasing hyperpolarization (open circles connected by broken line).

