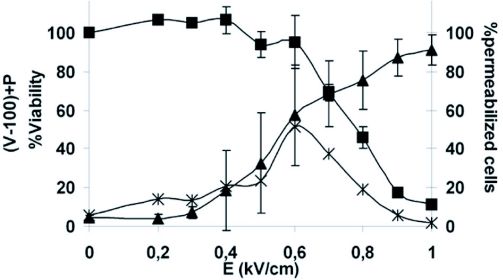
Figure 1.
Electric field intensity effect on permeabilization and viability. Percentages of permeabilized cells, cell viability and viable permeabilized cells were plotted as a function of the electric field intensity. Permeabilization was assayed by the penetration of PI in cells and analyzed by flow cytometry (▲). The live cells were determined 24 hrs after the treatment by crystal violet coloration (■). Error bars represent standard deviation. The percentage of viable permeabilized cells were determined by calculating (permeabilization (%)+viability(%) −100).

