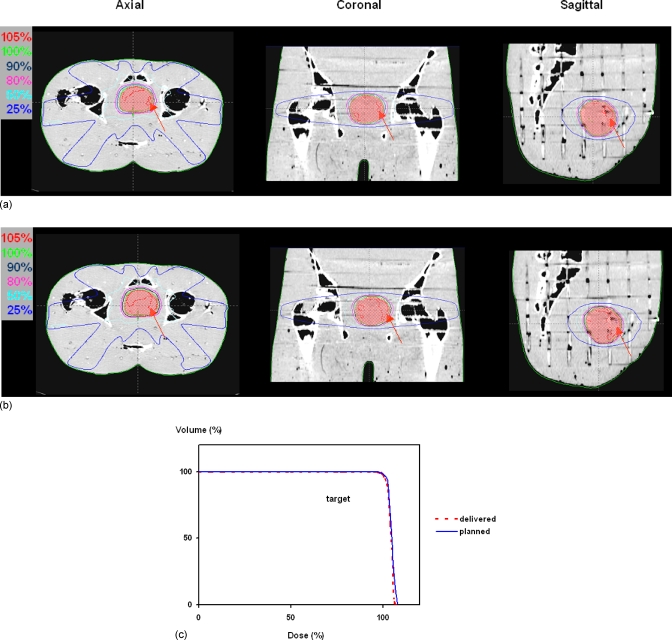
Figure 7.
(a) Delivered dose distribution calculated with fluence maps derived from EPID-measured leaf sequence files. (b) Expected dose distribution calculated with planned fluence maps. The differences in the dose distribution (105% level) between the delivered and expected dose distributions for the three orthogonal planes are highlighted by the arrows. (c) The DVHs of the targets from the two dose reconstructions essentially overlapped each other except at the dose level beyond 105%.

