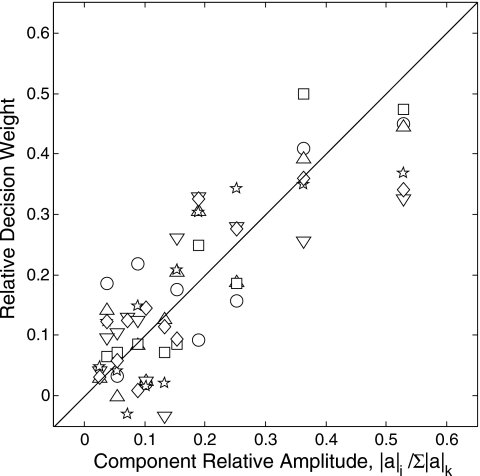
Figure 3.
Scatterplot of the relation between the relative weights of listeners and the relative amplitude of partials for two-interval, forced-choice identification of target plates. Weights on the change in frequency and decay have been averaged for each listener to obtain a single weight for each partial (see the text for details). Symbols denote data from different listeners (S1=circle, S2=upright triangle, S3=square, S4=inverted triangle, S5=star, S6=diamond).

