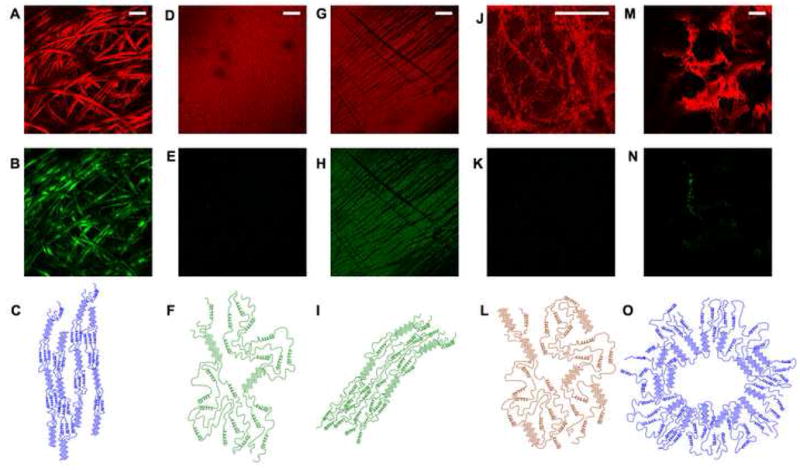
Figure 2. Two photon excited fluorescence and second harmonic generation images of silk biomaterials.

Fluorescence (A, D, G, J, M) and SHG (B, E, H, K, N) images collected simultaneously from (A, B) Silk fibers, (D, E) a methanol-treated aqueous film, (G,H) a compressed and stretched methanol-treated aqueous film, (J,K) a hydrogel, and (M,N) a silk scaffold. All images were acquired with 800nm excitation through a 20× (0.7NA) objective. Fluorescence was collected through a 525nm filter with a 25nm band pass. SHG was collected in the forward direction through a 410nm filter with a 20nm band pass. Some of the main secondary structure features, including b sheet content and alignment are depicted for (C) silk fibers, (F) methanol treated films, (I) compressed methanol treated films, (L) hydrogels, and (O) scaffolds. (Bar A-GM =100μm, Bar J = 20μm)
