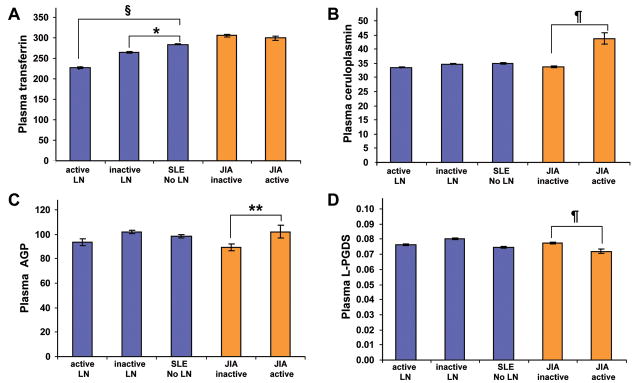
Figure 1. Plasma concentrations of the PS-proteins.
Values are means and SE in mg/dL. Significant differences are based on Tukey post-hoc testing. The histograms show the level of the PS-proteins, Tf (A), Cp (B), AGP (C) and L-PGDS (D). SLE patients with active lupus nephritis (LN), inactive LN or without LN are compared with groups were defined by the SLEDAI. Twenty children with active and 10 with inactive JIA served as controls. Significant differences between groups are indicated as follows: *= P<0.02; **= P<0.01; ¶= P<0.001; §= P<0.0002.

