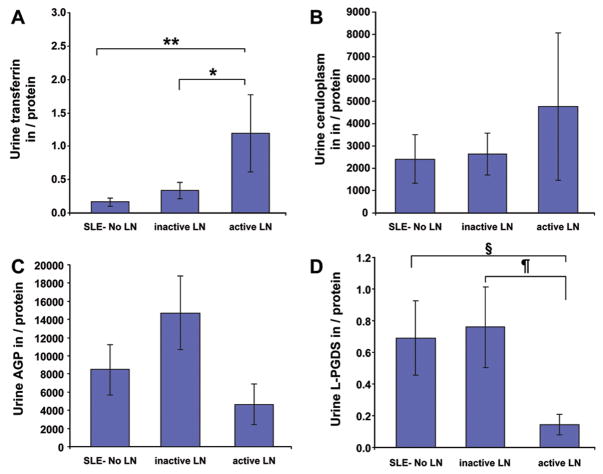
Figure 4. Urinary concentration of the PS-proteins.
Values are means and SE. Significant differences are based on Tukey post-hoc testing. The histograms show urinary concentrations of Tf (A), Cp (B), AGP (C) and L-PGDS (D) for the groups defined as Figure 1. PS-protein excretion standardized by nonselective proteinuria is depicted with significant differences between groups indicated as follows: * = P<0.05; ** = P<0.005; § = P<0.02; ¶ = P<0.009.

