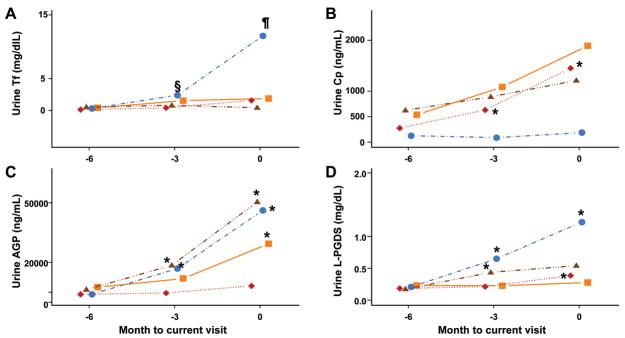
Figure 5. Changes of the PS-proteins in relationship to future changes in LN activity.
Values are geometric means of uncorrected urinary levels of Tf (A), Cp (B), AGP (C) and L-PGDS (D) at months -6, -3 and 0, respectively. Month 0 is the time point when the clinical diagnosis of the course of LN is made and months -3 corresponds to the timepoint of 3 months prior to the clinical diagnosis of the LN flare. ‘Improved LN’ describes the course of LN with decreasing renal SLEDAI scores; ‘worse LN’ describes the course of LN associated with an increase of the renal SLEDAI scores; ‘stable active LN’ describes patients with stable renal SLEDAI scores > 0; and ‘inactive LN’ describes the course of continuously inactive LN (renal SLEDAI = 0). Significant differences in the levels between two consecutive visits are indicated in the plots as follows. § = P< 0.009; ¶ = P<0.0001; * = P<0.001. The above defined LN courses are depicted as follows: Improved LN, squares; Worsened LN, circles; Stable active LN, triangles; Inactive LN, diamonds.

