
Fig. 4.
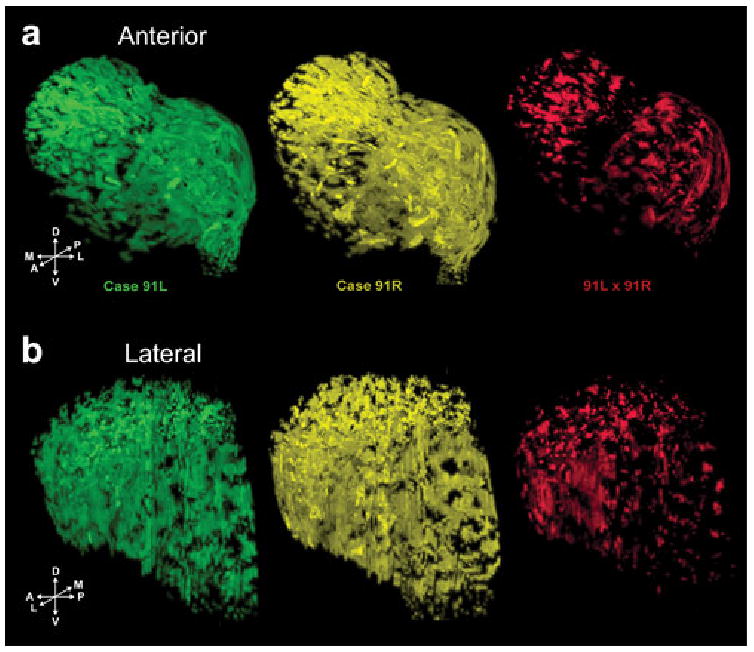
Volumetric visualization of results from spatial averaging of striosomes for cases 91L and 91R (Fig. 3). Individual striosomes from the left hemisphere (91L, green) and right hemisphere (91R, yellow), and their voxel-wise product of intensity values (91L × 91R, red). Overlap between the striosomes in the two hemispheres is 14.7% of the total individual striosomes, underscoring the spatial variability of the striosomes.