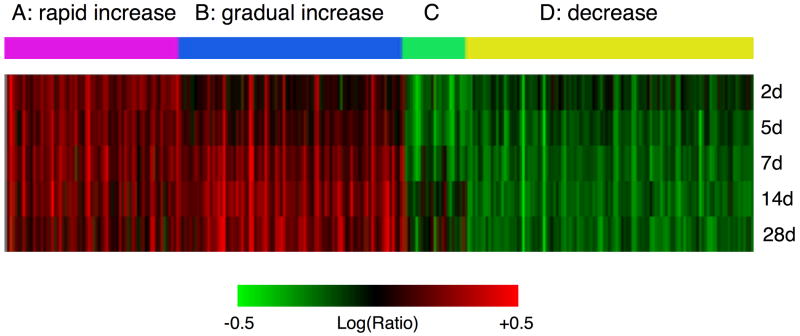
Figure 2.
Clustering by self-organizing maps (SOM analysis) of mouse mammary gland gene expression after estradiol treatment. A. Red and green represent up- and down-regulated genes, respectively. Combined cluster representing gene expression changes from two, five, seven, fourteen or twenty-eight days of treatment with 17β-estradiol (p ≤ 0.001 in both biological replicates for d7, d14, and d28, or in the one biological replicate for d2 and d5). The 4-colour bar labeled A, B, C, and D indicates gene expression patterns identified by SOM analysis.

