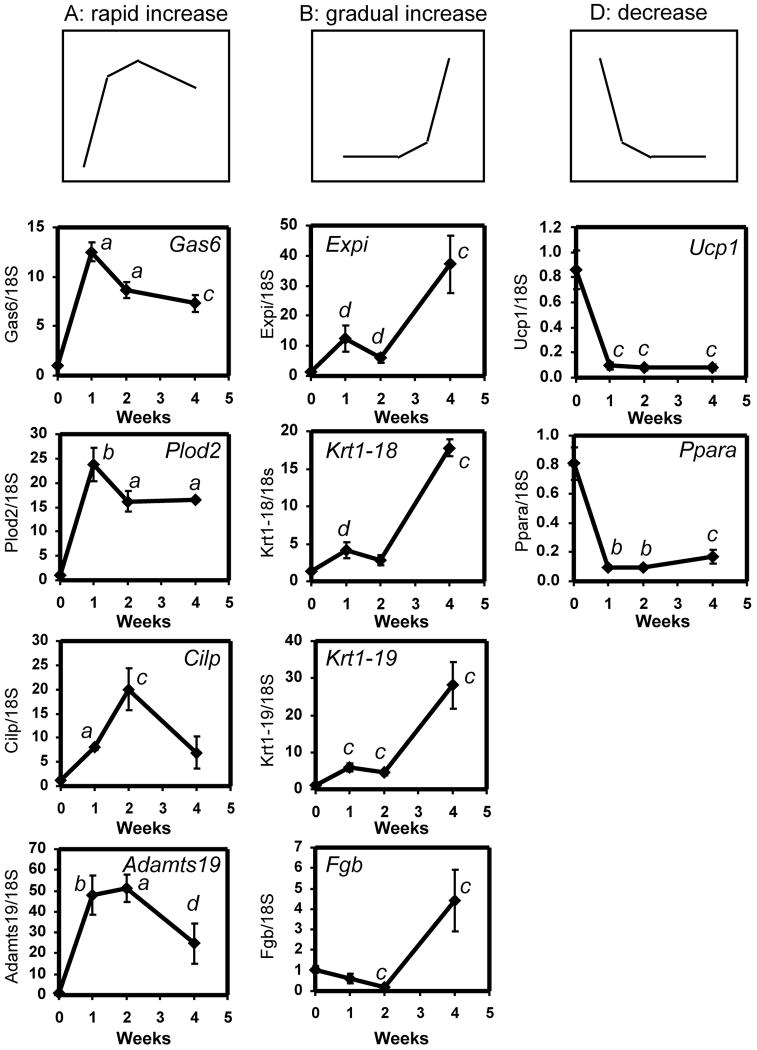
Figure 3.
Confirmation by quantitative PCR of estrogen regulation of selected genes observed in microarray analysis (Table 2). RNA was prepared from one #4 mammary gland from each of 4-5 mice and cDNA was prepared and analyzed from individual mammary glands. Each graph was generated from one of two independent time-course experiments. Genes representative of each of the three major patterns identified by SOM clustering (A, B, and D) were confirmed. Results are expressed as the ratio of the variable gene to the 18S control, ± SEM. a, p < 0.0001 vs. placebo; b, p < 0.001 vs. placebo; c, p < 0.01 vs. placebo; d, p < 0.05 vs. placebo (unpaired, two-tailed student’s t-test).

