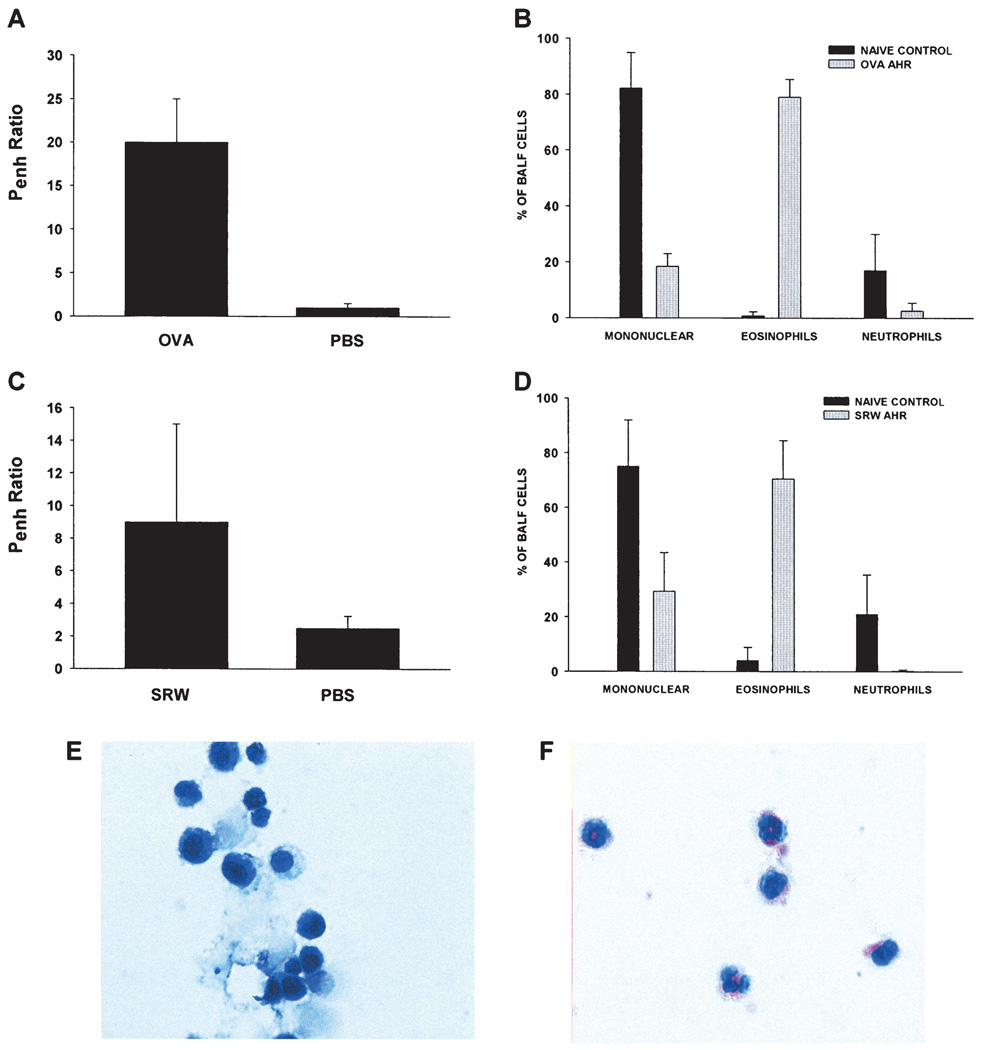
Figure 1. Airway hyperreactivity (AHR) in BALB/c mice using either OVA or SRW extract.
Airflow obstruction was assessed by whole-body plethysmography and recorded as enhanced pause (Penh)(A, C). Bronchoalveolar lavage fluid (BALF) was collected on day 28 (OVA) and day 23 (SRW) and inflammatory cell counts of cytospins were analyzed by compound microscopy (B, D) and stained with Geimsa to distinguish mononuclear cells (E) from eosinophils (F). Results in A–D represent means ± standard deviations. There were at least five mice in each of the BALF groups.

