
Figure 5.
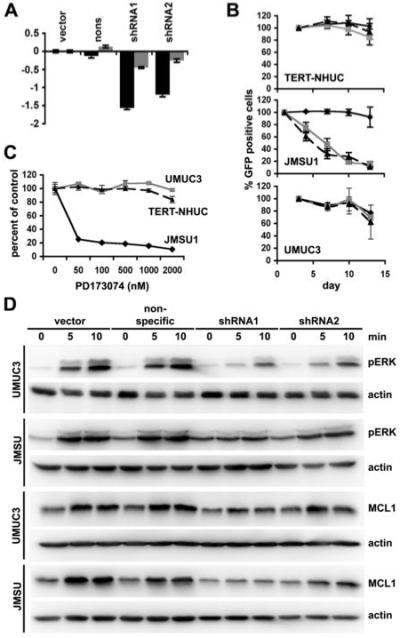
Bladder cancer cell line dependence on FGFR1. A, FGFR1 transcript levels in JMSU1 (grey bars) and UMUC3 (black bars) transduced with vector, non-specific shRNA, shRNA1 or shRNA2 were measured by real-time RT-PCR. B, TERT-NHUC, JMSU1 and UMUC3 were transduced with non-specific shRNA (solid black), shRNA1 (dashed black), or shRNA2 (grey) in retroviruses expressing GFP. Graph represents the percentage of GFP expressing cells remaining in culture compared to the number at the start of the experiment. C, TERT-NHUC (dashed black), UMUC3 (grey) and JMSU1 (solid black) were cultured with FGFR inhibitor PD173074. Cell survival was determined by MTT assay. D, JMSU1 and UMUC3 were starved in 0.1% FCS for 24 hours prior to culture with heparin and FGF2. Lysates were probed for pERK, MCL1 and actin.