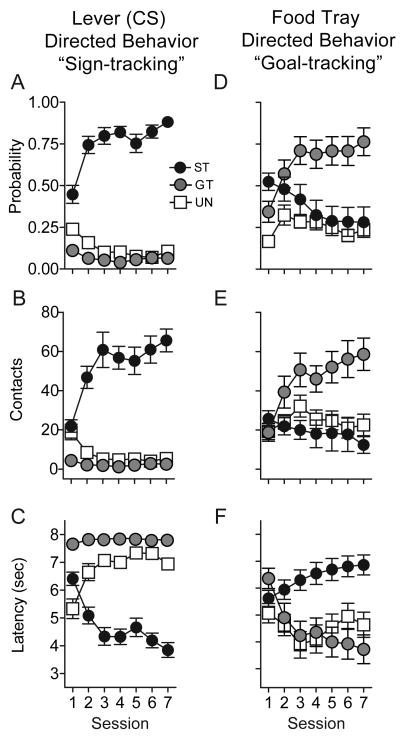
Figure 1.
Individual differences in the development of Pavlovian conditional responses (CRs) due to repeated pairing of a conditional stimulus (CS - an illuminated lever) with delivery of an unconditional stimulus (US - a food pellet). In one group of animals (UN, Unpaired, N = 20) the CS and US were presented pseudo-randomly. After training the “paired” group of animals was subdivided into two groups. The one third of animals that made the highest number of lever contacts were designated sign-trackers (ST, N = 18) and the one third that made the lowest number were designated goal-trackers (GT, N = 18). The panels on the left show three measures of behavior directed towards the lever-CS (sign-tracking behavior). Panel A shows the mean ± SEM probability of approaching the lever during the 8 sec CS period. Panel B shows the mean ± SEM number of lever contacts during the CS period, as indicated by sufficient pressure on the lever to record a “lever press”. Note however that lever contacts were typically caused not by “pressing” the lever with the paws, but by animals vigorously grasping and gnawing on the lever. Panel C shows the mean ± SEM latency to the first lever contact after CS presentation. The panels on the right show three measures of behavior directed towards the place where food will be delivered (goal-tracking behavior). Panel D shows the mean ± SEM probability of approach to the food tray during the 8 sec CS period. Panel E shows the mean ± SEM number of food tray beam breaks during the CS period. Panel F shows the mean ± SEM latency to the first beam break after CS presentation.

