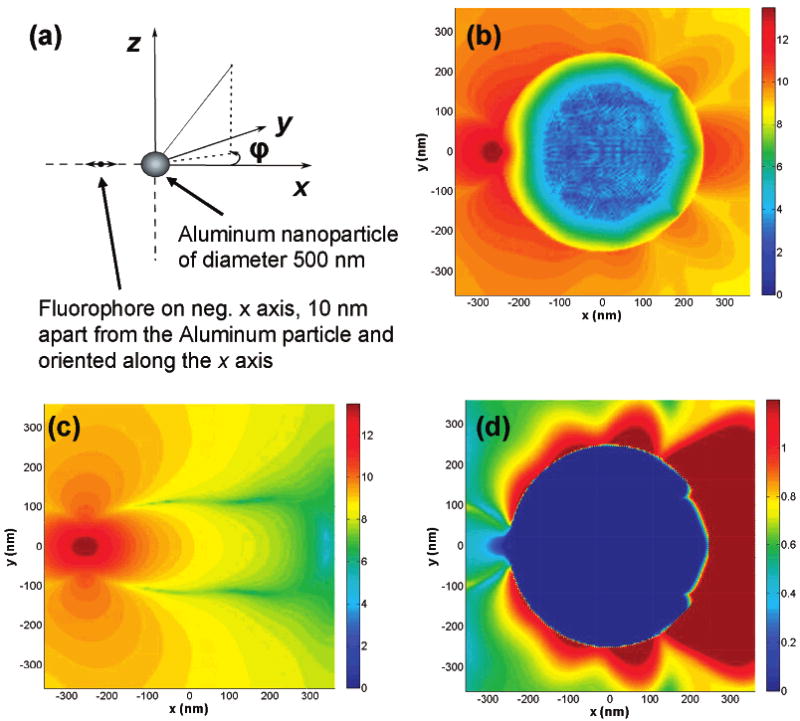
Figure 7.

(a) Schematic diagram of the model radiating fluorophore/metal nanoparticle system studied using FDTD; Near-field intensity distribution around (b) a 500 aluminum nanoparticle separated 10 nm from a fluorophore radiating at 375 nm and oriented along the x-axis, (c) near-field intensity distribution around the isolated fluorophore and (d) near-field enhancement around the aluminum particle. Note all images are displayed in the log scale.
