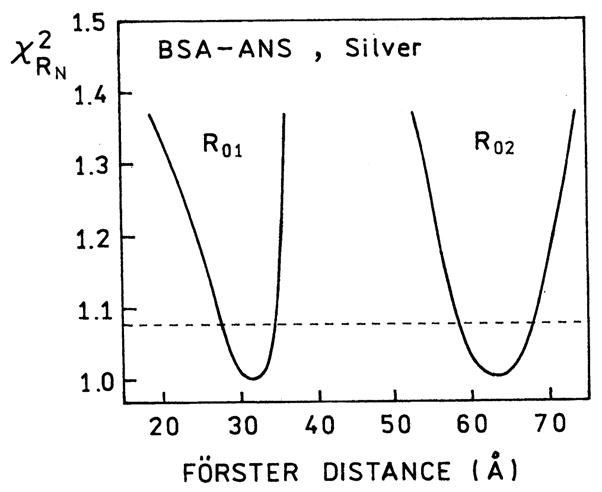
Fig. 7.

The resolution of recovered Förster distances are seen by the surfaces. The value of R01 (or R02) was kept constant while two other parameters were floating. The distance distribution parameters were kept constant at the values recovered in the cuvette (Table 2).
