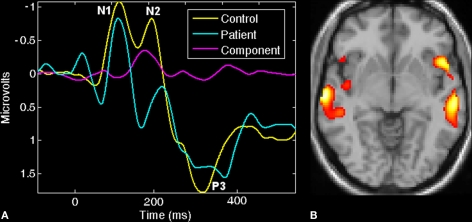
Figure 6.
ERP/fMRI jICA (from Calhoun and Adali, In Press). Joint component which showed significantly different loading parameters (p < 0.0001) for patients versus controls: (A) control (yellow) and patient (blue) average ERP plots along with the ERP part of the identified joint component (pink). (B) Thresholded fMRI part of the joint component showing bilateral temporal and frontal lobe regions.

