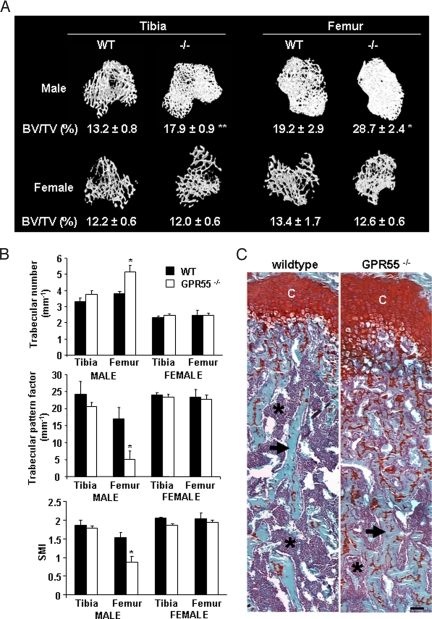
Fig. 4.
Trabecular bone volume is increased in male GPR55−/− mice. (A) μCT reconstructions of trabecular bone in the distal tibial and proximal femoral metaphysis at 12 weeks of age, with mean percent BV/TV values. (B) Significant changes in trabecular number, trabecular pattern factor, and structure modulus index. Black bars indicate wild-type (WT) mice; white bars indicate GPR55−/− mice. Data are mean ± SEM from 8 wild-type and 4 GPR55−/− male and female mice. Student's t test; *, P < 0.05; **, P < 0.01 compared with wild type. (C) Sections of femora were stained with toluidine blue and Safranin O. Note the increased presence of cartilage remnants (orange) in the trabecular bone (blue) of the GPR55−/− mouse. Asterisks indicate bone marrow (purple); arrows indicate trabecular bone; C, chondrocytes. (Scale bar: 20 μm.)

