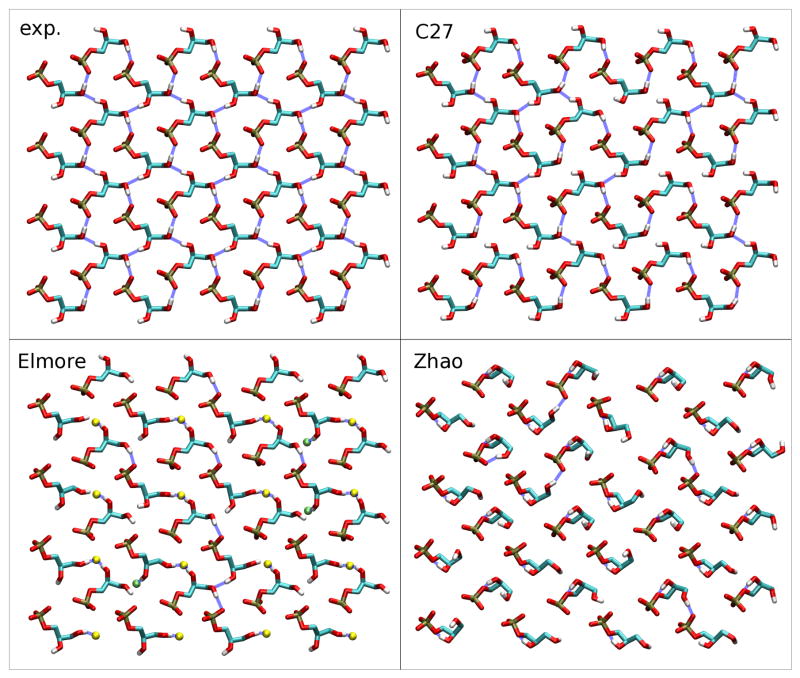
Figure 4.
Hydrogen-bonding network in the crystallographic structure (exp.) and after a short simulation with one of three models: CHARMM (C27), Elmore13 and Zhao et al.14 For clarity, only the phosphate and glycerol groups are represented, and non-polar hydrogens of C27 are omitted. For the Elmore model, some ester carbonyl oxygens are shown as pale green spheres (sn-1), resp. yellow spheres (sn-2). Blue dashed lines indicate hydrogen bonds.

