Figure 6.

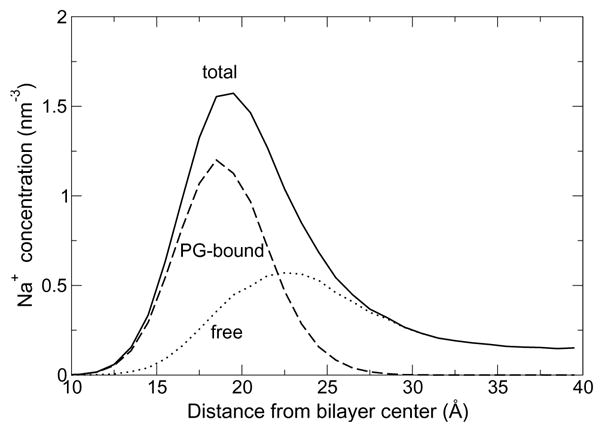
Vertical distribution of sodium counterions in the CHARMM POPG bilayer simulation (solid line). Sodium ions bound to PG oxygen atoms (dashed line) or free in solution (dotted line) are shown separately.

Vertical distribution of sodium counterions in the CHARMM POPG bilayer simulation (solid line). Sodium ions bound to PG oxygen atoms (dashed line) or free in solution (dotted line) are shown separately.