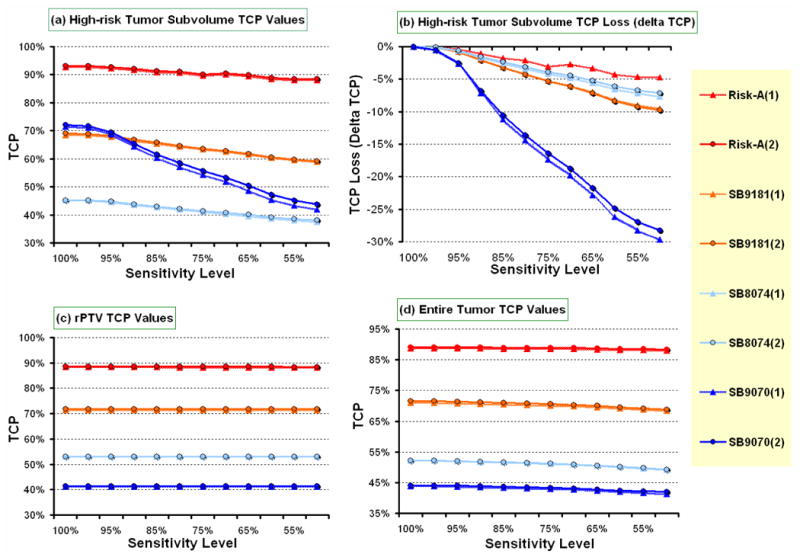
Figure 3.

Shows the impact of loss in sensitivity on local tumor control probability (TCP) for the four different selective boosting scenarios for (a) the nodule, (c) the rPTV, and (d) the entire PTV. Panel (b) shows the accumulated TCP loss for the nodule as a function of loss in sensitivity.
Abbreviations: nodule = a high risk tumor subvolume, rPTV = a remaining PTV, Risk-A = risk-adaptive optimization, (1) = TCP evaluated by Poisson TCP model, (2) = TCP evaluated by Logistic TCP model.
