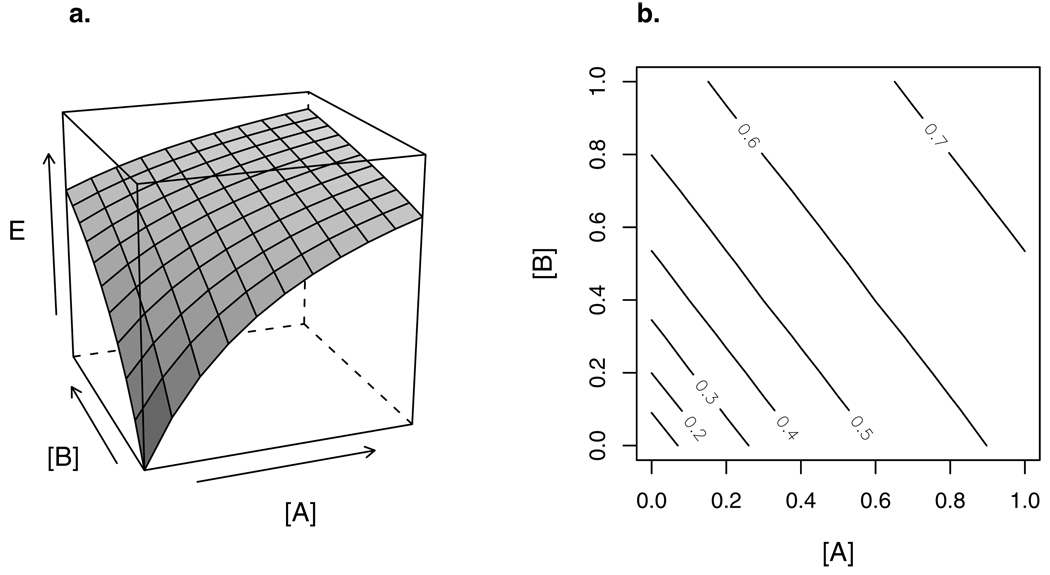
Figure 1.
(a) 3-D response surface of a combination of two agents: concentrations [A] and [B] are shown on the x and y axes, and concentration-additive response E on the z axis. The marginal concentration-response curves of A and B — the concentration-response curve for each compound individually — can be read on the xz and yz planes, respectively.
(b) Isoboles (contours) of the response surface in (a). These isoboles are straight, indicating concentration additivity. In this case they are also parallel, indicating that the two agents can be represented by a TEF, i.e., their dose-response curves differ only by a constant factor of potency.

