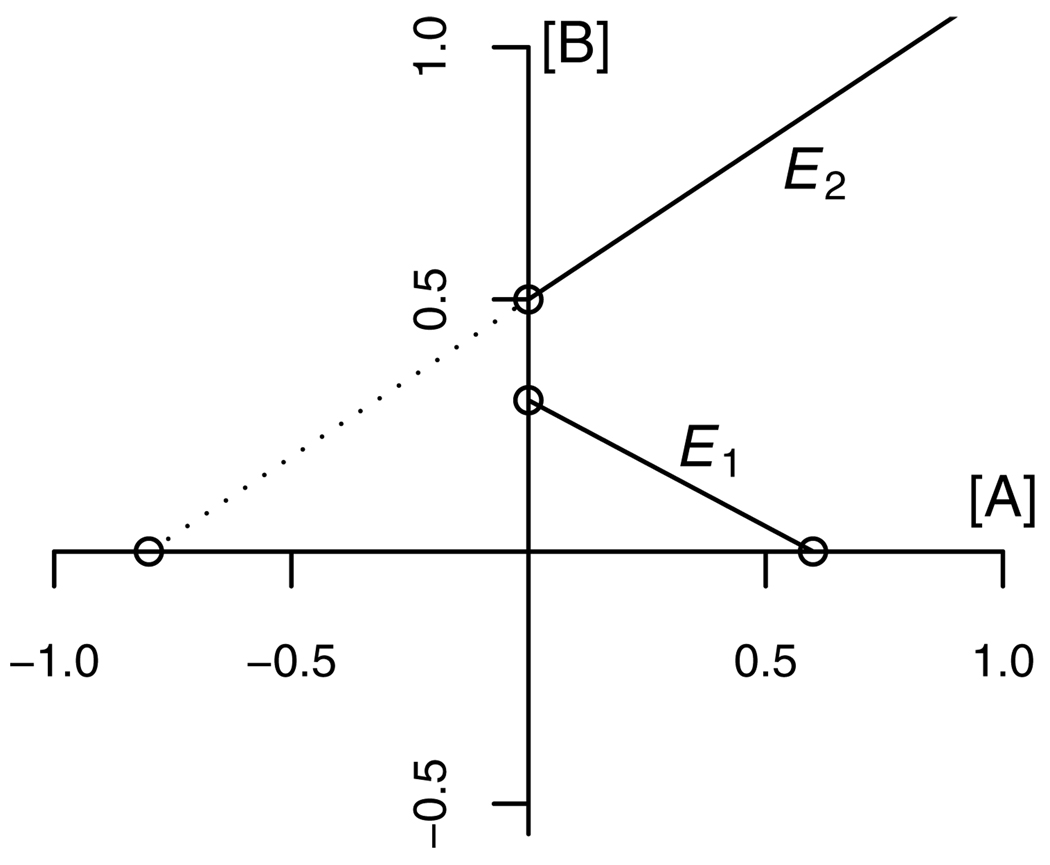
Figure 3.
Construction of the isobologram when A is a partial agonist relative to B. For a given effect level E, the GCA equation (7) describes an isobole which is linear with an intercept along the A-axis given by fA−1(E). Let αA and αB be the maximal effect levels of the two compounds. For effect levels E<αA<αBfA−1(E) is a positive number ([AE] in equation 3). Then the A-intercept of the isobole is positive and the isobole has a negative slope, as shown here for isobole E1. Suppose that for effect levels αA<E<αBfA−1(E) is negative. Then the A-intercept of the isobole is negative and the isobole has a positive slope, as shown here for isobole E2.

