Figure 4.
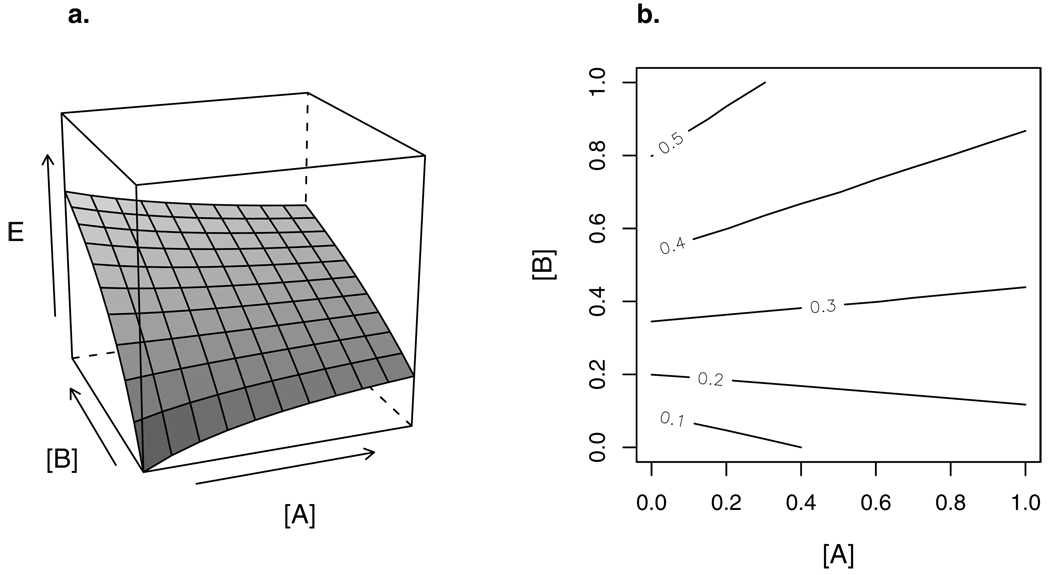
(a) Response surface of a combination of full agonist B with partial agonist A. At low concentrations, A adds to the effect produced by B. At large concentrations, A competes with B for receptors, lowering the joint effect.
(b) Isoboles of the response surface in (a). The isoboles are always linear, but switch from negative to positive slope as the maximal effect of partial agonist A (here, αA=0.25) is exceeded.

