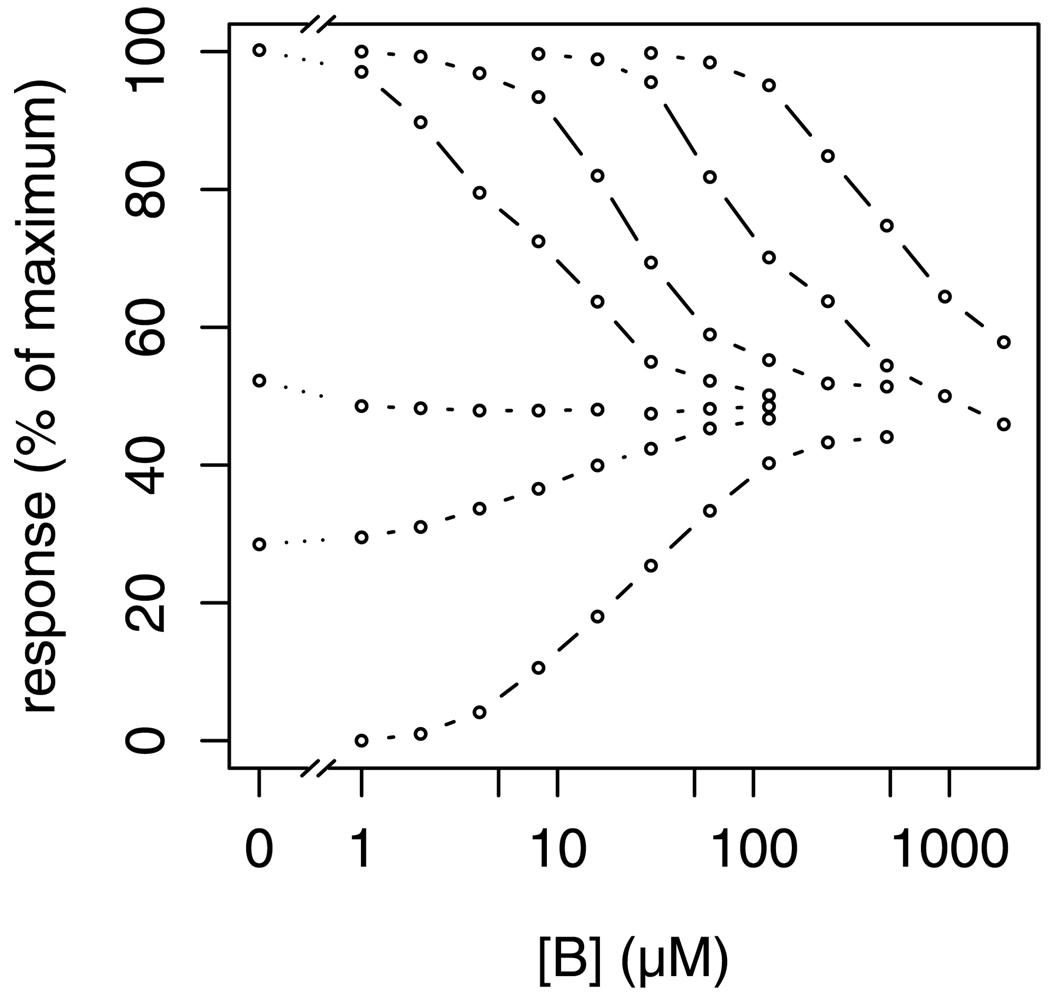
Figure 6.
Combination experiment of a partial agonist (B, on the x-axis) with a full agonist A. Curves indicate concentrations of A, from top, 2048, 512, 128, 32, 4, 2, and 0 µM. Response is percent of maximal contraction of isolated rat jejunum. Data are from Goldstein et al. 1974.

