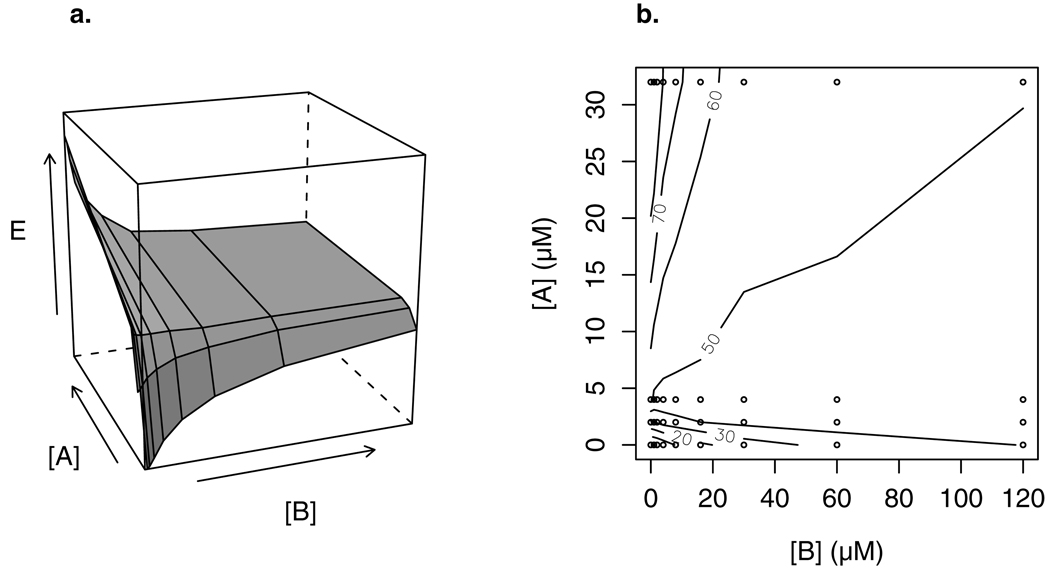
Figure 7.
(a) Response surface of the combination of two muscarinic agonists from the data in Figure 6: Full agonist A and partial agonist B.
(b) Isobologram of the response surface in (a), generated by plotting isoboles with the contour() function in R (www.r-project.org, version 2.4.1). The [A] and [B] ranges are the same as in (a); labels on isoboles are percent response. Isoboles switch from negatively to positively sloped as the effect level exceeds the maximal effect of the partial agonist B (about 44%, corresponding to a concentration of about 4 µM of full agonist A). Data points from Figure 6 are given by circles; isoboles are interpolated at all other points. Due to the large range of concentrations in the original data, only a part of the full combination space of Figure 6 is shown.

