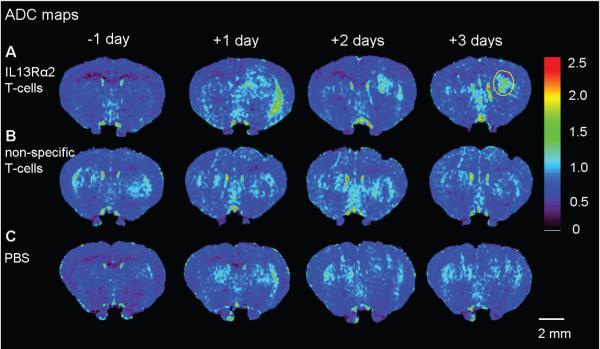
Figure 2. (A-C) Evolution of apparent diffusion coefficient (ADC) following IL13Rα2 T-cells, non-specific T-cells, PBS, and corresponding ADC-histograms (D-F).
A single coronal slice matching the slice position of the T2-weighted images is shown for one animal at one day prior to and at one, two and three days post corresponding treatment. The ADC values within the glioblastoma became significantly increased at two and three days following IL13Rα2 T-cell adoptive transfer (A). There was no significant increase in ADC values following non-specific T-cell or PBS treatment (B, C). Yellow circle shows a typical region of interest used for calculating mean ADC-values and ADC-histogram distribution.
A significant change in ADC-histogram distribution was only present for IL13Rα2 T-cell treated group (D) two and three days post treatment. There were no changes in ADC-histogram distribution for non-specific T-cell (E) or PBS (F) treated animals. Two-sample Kolmogorov-Smirnov test, * p<0.001.


