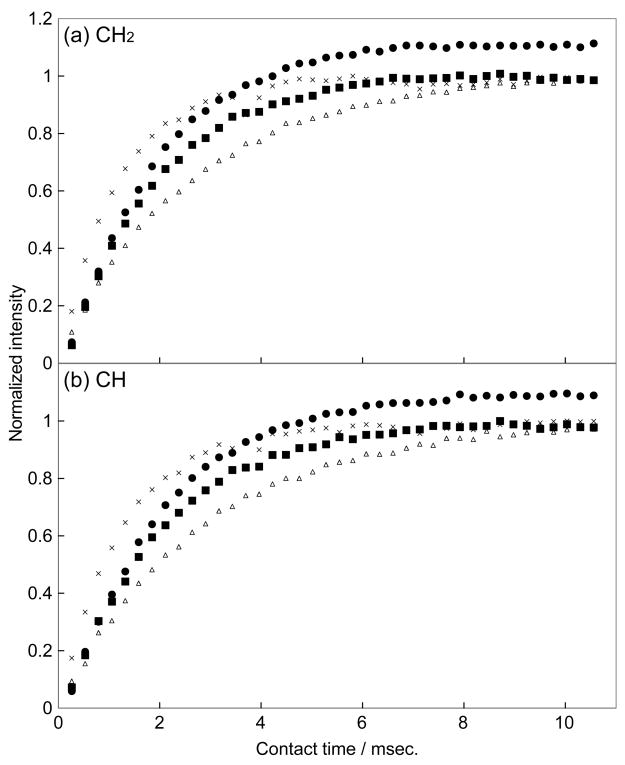
Figure 4.
Cross-polarization build-up curves for a static adamantane sample: (a) CH2 peak and (b) CH peak. Crosses, open triangles, closed squares, and closed circles indicate the intensities obtained from CP, rampCP, COMPOZER-CP, and the supercycled COMPOZER-CP experiments, respectively. The signal intensities were normalized by the maximum intensity of the CH2 or CH peak obtained in a CP.

