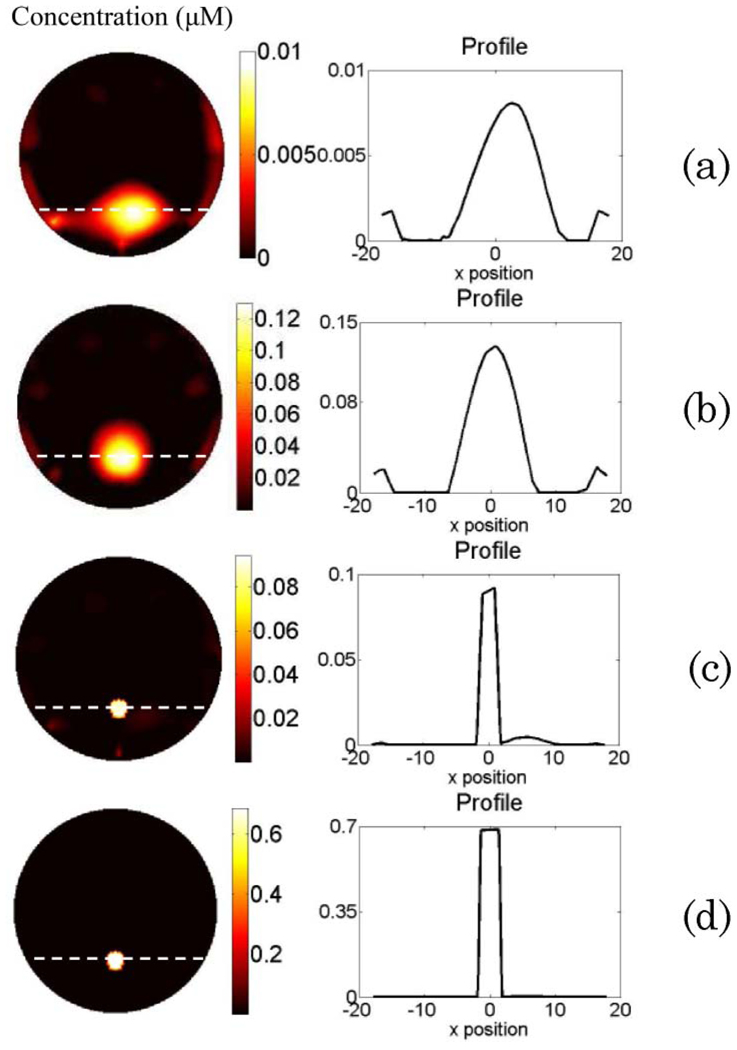
Fig. 5.
(Color online) Phantom study results for Case 3. The reconstructed fluorophore concentration maps are shown in the left column when (a) using erroneous absorption coefficient and disregarding the background heterogeneity; (b) using reconstructed absorption map from DOT measurement as the functional a priori information in the FT reconstruction; (c) using erroneous absorption coefficient, disregarding the background heterogeneity, and using only the structural a priori information for FT reconstruction; (d) using reconstructed absorption map as the functional a priori information and applying the structural a priori information during the FT reconstruction. The right column is the plot of the profile along the x axis across the fluorescence object (as indicated by the dashed line in the reconstructed map).

