Fig. 1.
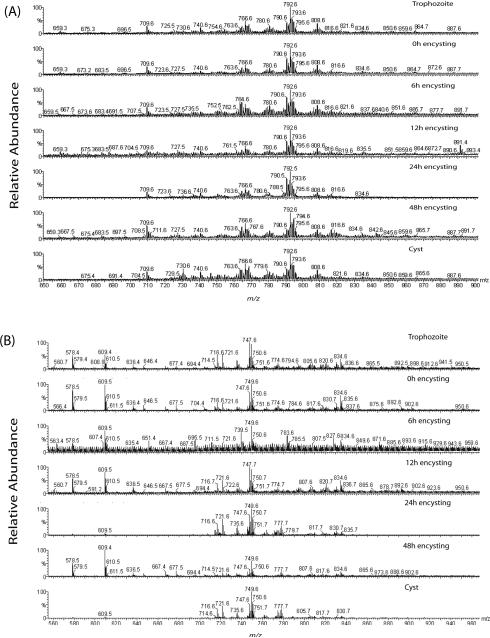
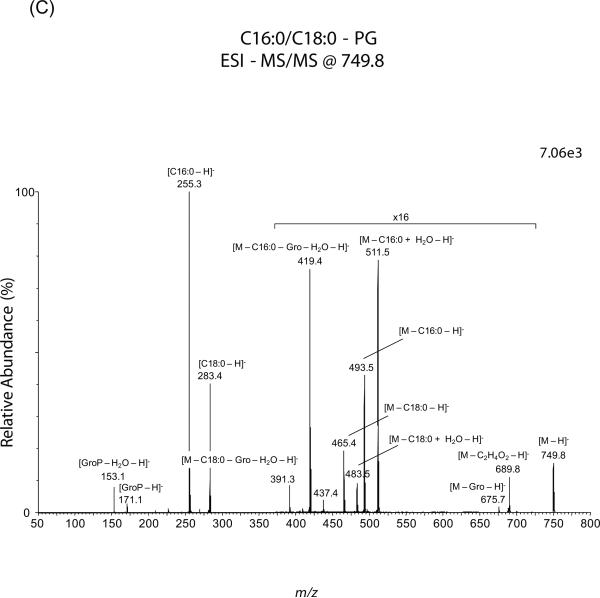
Lipid analysis by MS of G. lamblia. Total phospholipids were fractionated by silica-gel 60 and analyzed by ESI-QTOF-MS. (A and B) Positive- and negative-ion mode full-scan spectra of giardial phospholipids, respectively. Total lipids and phospholipids from vegetative, encysting and water-resistant cysts were isolated as described in the Materials and Methods. (C) MS-MS spectrum of C18:0/16:0-PG parent-ion at m/z 749.5, ionized in negative-ion mode. “x16” indicates that the portion of that spectrum was magnified sixteen times to make the peaks more visible. The number at the top right corner of each spectrum indicates signal strength, measured as ion intensity at 100% relative abundance. m/z, mass to charge ratio.


