Figure 5.

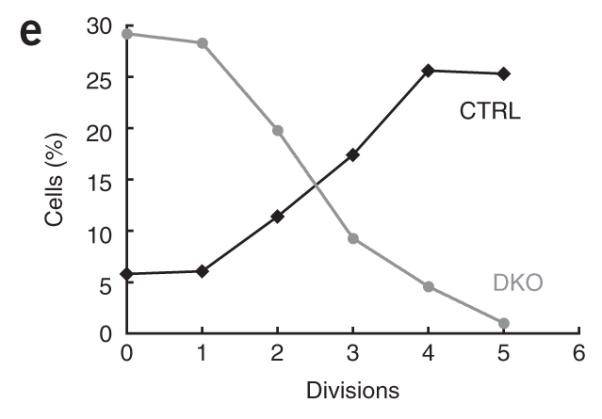
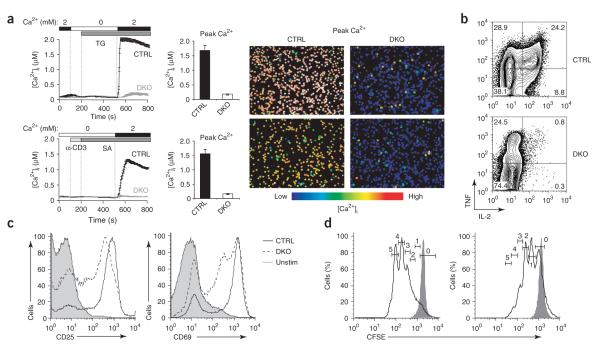
Impaired Ca2+ influx, cytokine production and proliferation in double-knockout T cells. (a) Store-operated Ca2+ influx in naive CD4+ T cells from littermate control mice (CTRL; Stim1fl/flStim2fl/fl) and double-knockout mice (DKO; Stim1fl/flStim2fl/fl CD4-Cre), stimulated with thapsigargin (top) or with anti-CD3 followed by crosslinking with streptavidin (SA; bottom) in nominally Ca2+-free Ringer’s solution, followed by perfusion with 2 mM Ca2+ in Ringer’s solution to induce Ca2+ influx (left). Middle, quantification of peak [Ca2+]i in 2 mM Ca2+ in Ringer’s solution. Right, single-cell ‘false-color’ images showing [Ca2+]i at the peak of the Ca2+ influx response. Original magnification, ×20. (b) Production of IL-2 and tumor necrosis factor (TNF) by naive CD4+ T cells from control (Stim1+/+ CD4-Cre or Stim1fl/flStim2fl/fl) or double-knockout mice, stimulated for 6 h with PMA and ionomycin. (c) Expression of CD25 and CD69 on naive CD4+ T cells from control (Stim1+/+CD4-Cre or Stim1fl/flStim2fl/fl) or double-knockout mice, left unstimulated (Unstim; control cells) or stimulated for 16 h with anti-CD3 and anti-CD28 (control (CTRL) or double-knockout (DKO) cells). (d) Proliferation of naive CD4+CD25– T cells from control (Stim1fl/flStim2fl/fl) or double-knockout mice, stimulated for 72 h with anti-CD3 and anti-CD28 and assessed by CFSE labeling. Open histograms, stimulated cells; shaded histograms, unstimulated cells. Numbers above bracketed lines indicate number of cell divisions. (e) Cells undergoing zero to five cell divisions (from data in d). Stim1+/+ or Stim2+/+ CD4-Cre mice were used initially as controls, after which Stim1+/+ CD4-Cre, Stim2+/+ CD4-Cre and Stim1fl/flStim2fl/fl mice were used. Data are representative of three (a) or two (b—d) independent experiments (error bars (a), s.e.m.).

