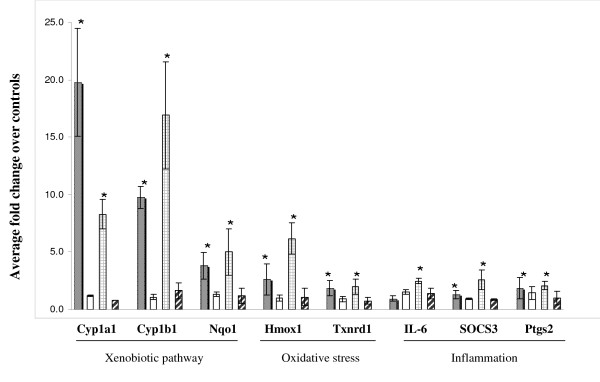
Figure 3.
Validation of microarray results. Data are presented as fold change relative to sham controls. (n = 5 mice/group, ± SEM). Gray bars: 6 weeks smoke. White bars: 6 weeks smoke + 6 weeks break. Bars with hatched lines: 12 weeks smoke. Bars with diagonal lines: 12 weeks smoke + 6 weeks break. * indicates significant results.

