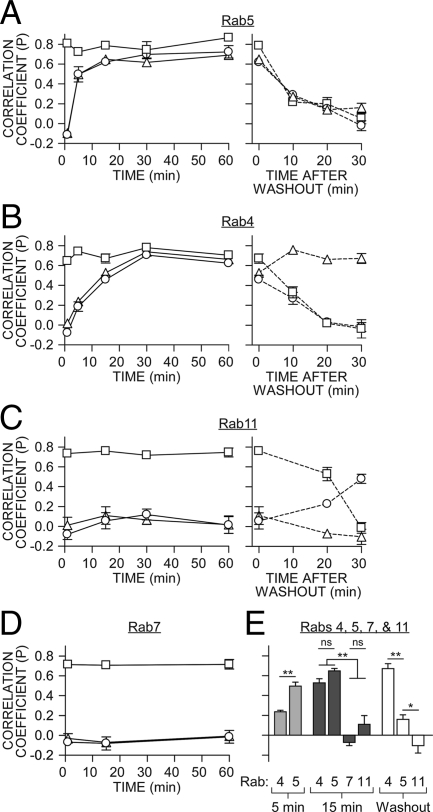
Figure 6.
Colocalization of Rabs with TRH receptor. Pearson’s correlation coefficients for: 2HA-AP-TRH receptor with phospho-TRH receptor (squares), 2HA-AP-TRH receptor with GFP-Rabs (triangles) or phospho-TRH receptor with GFP-Rabs (circles) are shown as mean ± se (n = 3–12). A–D: Left panel, values from cells stimulated with TRH; A–C, right panel, values after agonist washout. E, Comparison of selected coefficients from panels A–D for colocalization of 2HA-AP-TRH receptor and particular Rab GTPases 5 or 15 min after stimulation with TRH or 30 min after agonist washout. **, P < 0.001; *, P < 0.05; nonsignificant (ns), P > 0.05 by one-way ANOVA.

