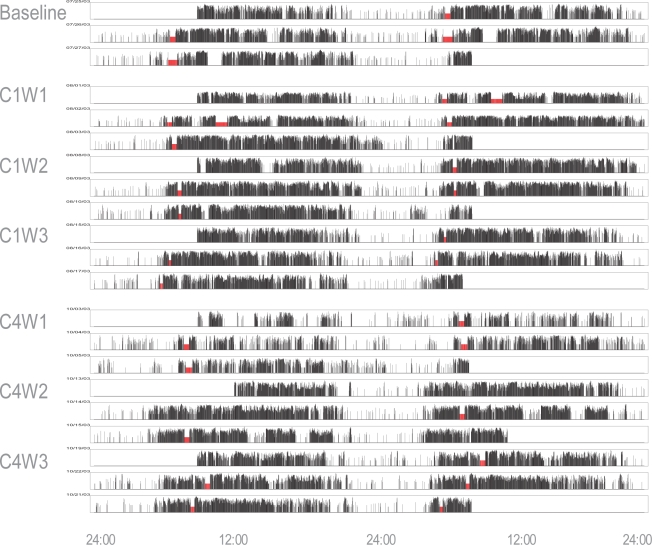
Figure 2.
One participant's raw actigraph data for 3 days during each time point of data collection. Double plot with the first row representing day 1 (midnight to midnight) and day 2 (midnight to midnight), the second row representing day 2 again followed by day 3 and so on. This patient had a robust circadian rhythm at baseline with a clear contrast between daytime and nighttime activity, minimal body movements during the night, and constant bedtime and wake time across the 3 nights. At cycle 1, the rhythm became disrupted with less constant bedtime and wake time and more activity during the night, a pattern that was aggravated at cycle 4 where the contrast between daytime and nighttime is less clear, particularly during week 1. Red bars = missing data (off wrist).

