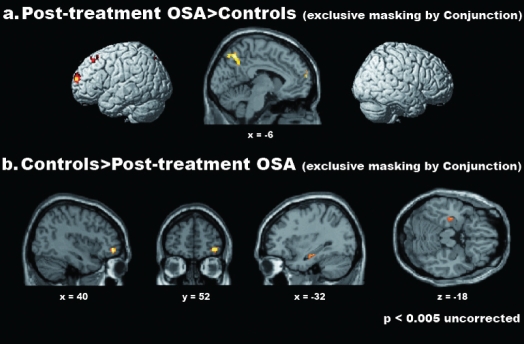
Figure 5.
Differential parametric effects of WM load in healthy controls and posttreatment OSA patients. From top to bottom, the regions showing significantly stronger parametric effects of WM-load on cerebral activity (i.e., increase) in posttreatment OSA patients vs. controls (a) and the regions that were more strongly activated in controls than posttreatment OSA patients (b), outside those highlighted by their Conjunction. Only for graphical purposes, activations are shown at an uncorrected threshold of P < 0.005. Activations were superimposed onto 3D-renderings of the MNI template and representative slices from the same brain.

