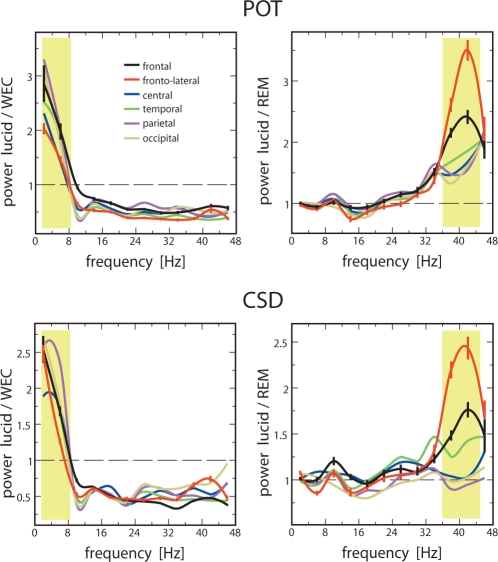
Figure 3.
Regions of interest (ROIs): Grand averages for the ratio of mean FFT power in lucid dreaming vs. wake with eyes closed (WEC) (left frames) and lucid dreaming vs. REM sleep (right frames) for the analyzed frequency bands. The yellow shaded areas indicate the frequency bands of relevance, i.e., increased power in lower frequencies in lucid dreaming compared to waking (left frames) and increased 40-Hz band activity in lucid dreaming compared to REM (right frames). Power based on scalp potentials (POT) is plotted in the upper frames and CSD in the lower frames. Standard errors are indicated by vertical bars for frontal and frontolateral ROIs to facilitate interpretation of the relevant results. Frequency resolution is 4 Hz. Statistics for the contrasts between lucid dreaming and REM for frontal and frontolateral ROIs, listed in succession for subjects 1, 2, and 3: frontolateral POT power: P < 0.01, t = 11.86, 27.86, 7.02, dfcorr = 234.46, df = 90, dfcorr = 57,44; frontolateral CSD power: P < 0.01, t = 17.31, 15.59, 9.07, dfcorr = 280, df = 90, dfcorr = 53.69. Frontal POT power: P < 0.01, t = 12.54, 24.71, 9.17, dfcorr = 307, df = 90, dfcorr = 59.11; frontal CSD power: P < 0.05, t = 11.25, 8.27, 2.41, df = 370, dfcorr = 61.14, df = 66.

