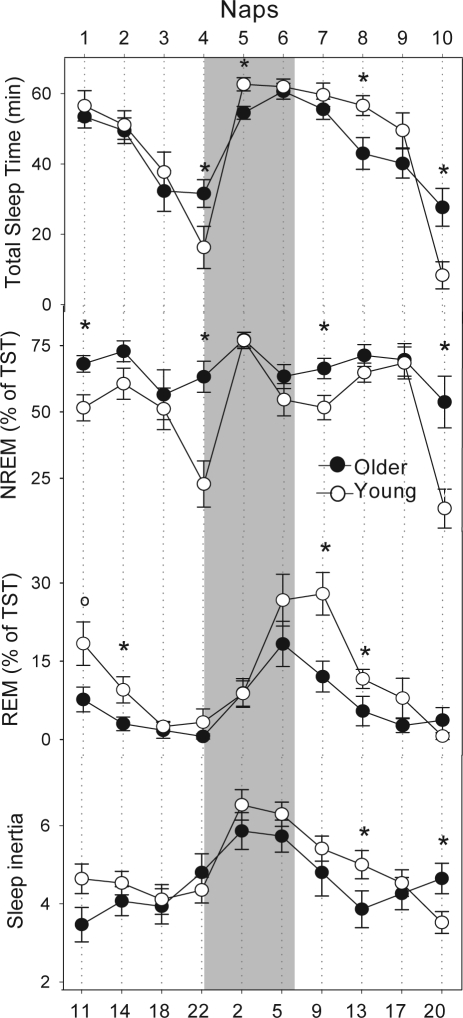
Figure 4.
The first panel shows total sleep time (TST), the second depicts NREM sleep, the third shows the REM sleep and the last panel represents the Karolinska Sleepiness Scale (KSS) ratings across the 40-h nap protocol between young (white circles, n = 17) and older volunteers (black circles, n = 15). The grey bar illustrates the biological night. Mean ± SEM. *P < 0.05.

