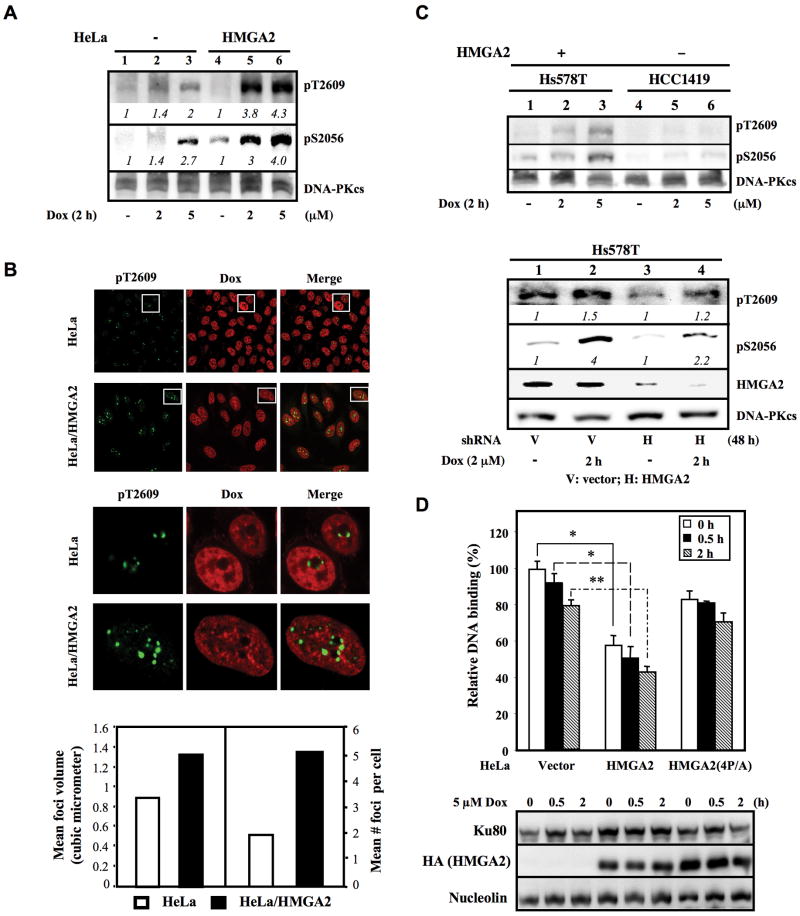
Figure 1. HMGA2 expression induces DNA-PKcs hyper-phosphorylation and reduces DNA end-binding of Ku80.
(A) Relative levels (numbers in italic) of Dox-induced pDNA-PKcs-T2609 and pDNA-PKcs-S2056 in HeLa and HeLa/HMGA2 cells normalized against that of DNA-PKcs are shown. (B) Confocal images of pDNA-PKcs-T2609 foci (green) and Dox (red) distribution in HeLa and HeLa/HMGA2 cells 30 min post-Dox (5μM) treatment. Middle-panel is enlarged view of the selected pDNA-PKcs-T2609 foci (upper-panel) as indicated by the white boxes. The mean foci volume (lower-left-panel) and the average number of foci per cell in 75-100 cells (lower-right-panel) are shown. (C, top-panel) Relative levels of Dox-induced pDNA-PKcs-T2609 and pDNA-PKcs-S2056 in Hs578T and HCC1419 breast cancer cells. (bottom-panel) Hs578T cells were transduced with vector or shHMGA2 for 72 h prior to Dox treatment. Relative levels of pDNA-PKcs-T2609 and pDNA-PKcs-S2056 normalized against that of DNA-PKcs are italicized. (D) Relative DNA binding by Ku in HeLa, HeLa/HMGA2, and HeLa/HMGA2(4P/A) cells following Dox treatment. *, p<0.05; **, p<0.01, from three independent experiments.

