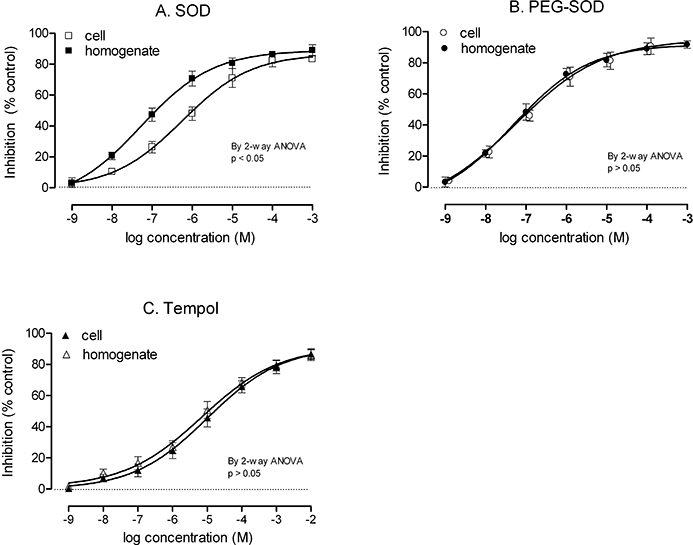
Figure 4.

Inhibition of angiotensin II (Ang II)-induced O2− generation in intact or homogenized preglomerular vascular smooth muscle cells by catalytic antioxidants. Cells were pretreated for 2 h with graded concentrations of superoxide dismutase (SOD) (Panel A), polyethylene glycol (PEG)-SOD (Panel B) or nitroxide 4-hydroxy-2,2,6,6,-tetramethylpiperidine-1-oxyl (Panel C), followed by incubation with 10−6 mol·L−1 Ang II for 4 h. Thereafter, O2− was measured by lucigenin-enhanced chemiluminescence. The values are expressed as mean ± standard error of the mean values for percentage inhibition, compared with control (0% inhibition, dotted line). anova, analysis of variance.
