
Figure 2.
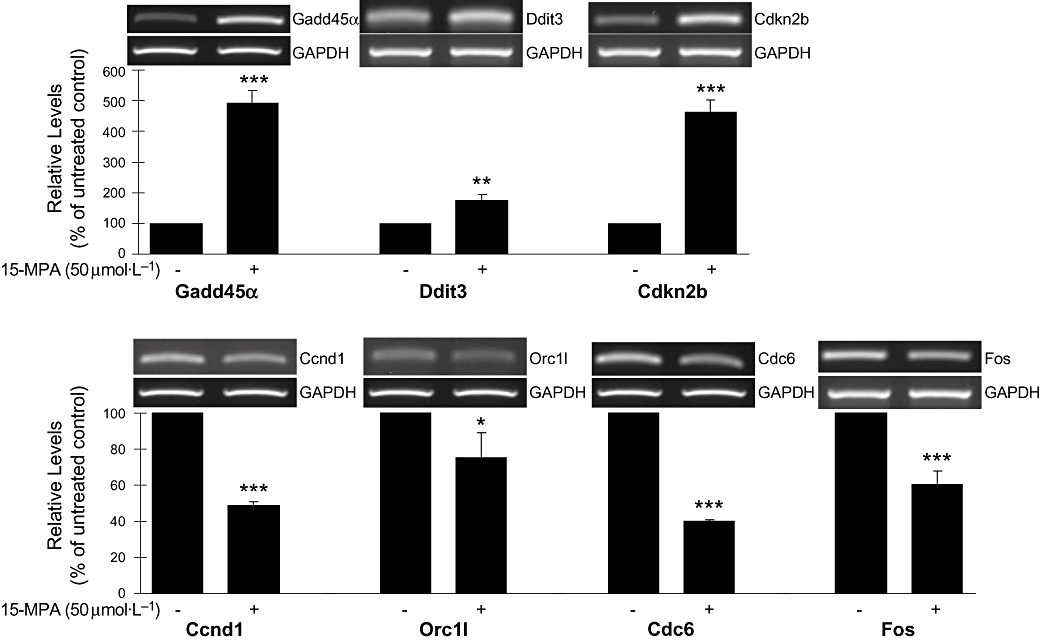
RT-PCR analysis of genes showing altered expression in microarray analysis. The level of mRNA transcript was assessed by semi-quantitative RT-PCR analysis. PCR product for each gene was resolved on ethidium-containing agarose gels, quantified by scanning densitometry and normalized to GAPDH level. The values shown are mean ± SD of data from three independent experiments. *P < 0.05; **P < 0.01; ***P < 0.001 versus untreated control. 15-MPA, 15-methoxypinusolidic acid; ccnd1, cyclin D1; cdc, cell division cycle; cdkn2b, cyclin-dependent kinase inhibitor 2B; ddit3, DNA damage-inducible transcript 3; GADD, growth arrest and DNA damage; ORC, origin–recognition complex; RT-PCR, reverse transcription-polymerase chain reaction.