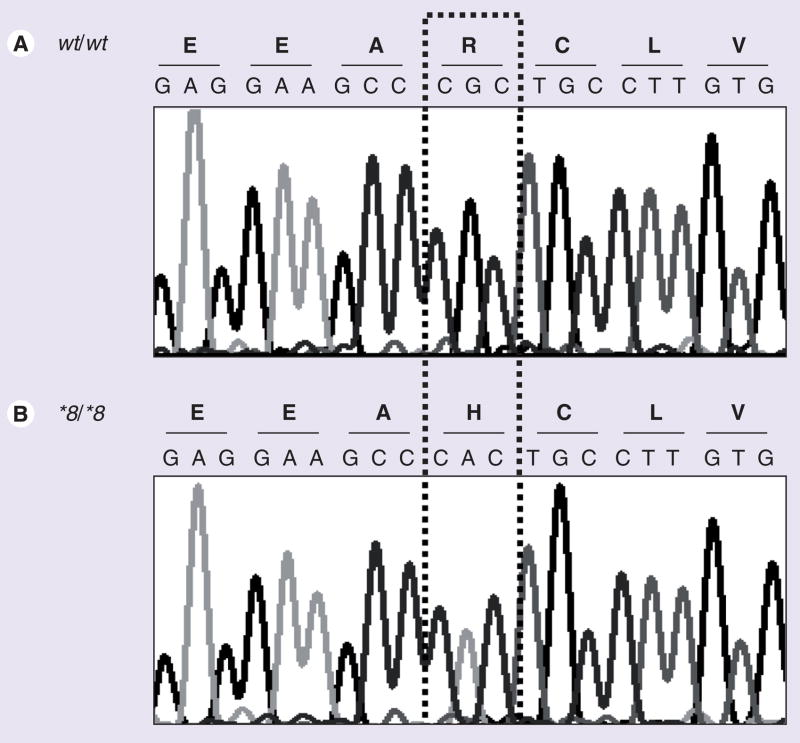
Figure 1. Sequence analysis of CYP2C9 exon 3 in the African–American index patient compared with that from a homozygous wild-type individual.
(A) Electropherogram illustrates the wild-type genomic DNA and amino acid sequences. (B) Electropherogram illustrates the CYP2C9*8/*8 genomic DNA (c.449G>A) and amino acid (p.R150H) sequences identified in the African–American index patient.
wt: Wild-type.

