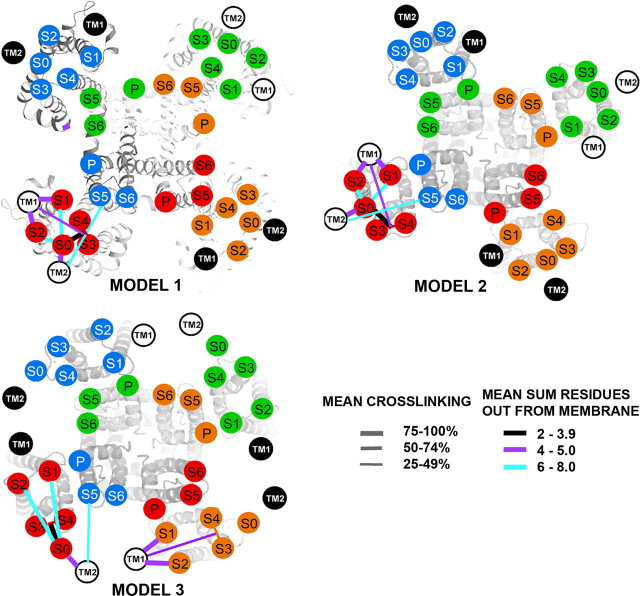
Figure 4.
Locations of the extracellular ends of β4 TM1 and TM2 relative to the extracellular ends of α S0–S6. Model 1, A Rosetta model of Kv1.2 in the closed state (Yarov-Yarovoy et al., 2006) is the template for locating the extracellular ends of BK α S1–S6, represented as number circles. The position of S0 is as reported previously (Liu et al., 2008a). Models 2 and 3, The template is the crystal structure of Kv1.2 in the open state (Long et al., 2005). In Model 2, the position of S0 relative to S1–S4 is the same as in model 1. In model 3, the position of S0 is outside of S1–S4. The locations of the extracellular ends of β4 TM1 and TM2 are represented by labeled black and white circles. TM1 and TM2 from two β4 subunits are represented by white circles with black numbers and two β4 subunits by black circles with white letters. In models 1 and 2, TM1 and TM2 from one β4 subunit straddle one α subunit. In model 3, TM1 and TM2 from one β4 subunit are between two α subunits. For each pair of flanks, the mean of the top three extents of crosslinking (see Materials and Methods) is coded by the thickness of the connecting line (see legend in figure). To indicate the distance of a crosslink from the ends of the TM helices, we added the number of residues out from the membrane of each of the two Cys. The mean of these distances for the top three extents of crosslinking is indicated by the color of the line (see legend in figure). P, Pore.

