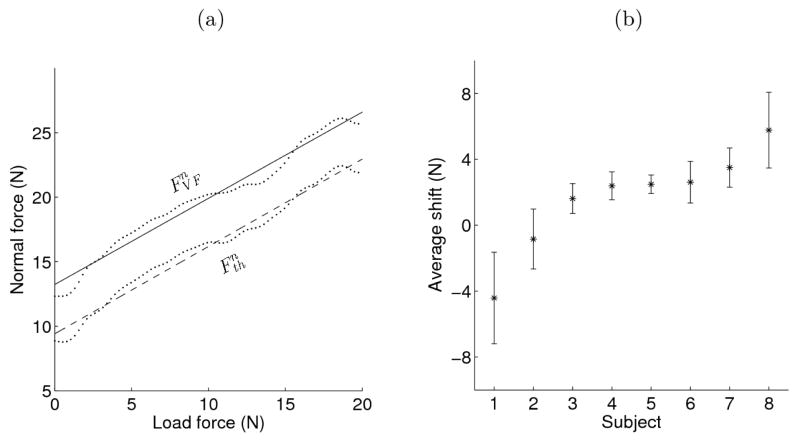
Figure 3.
Thumb and VF normal forces during the increase of tangential force from 0 to 20 N. (a) Typical thumb and VF normal forces. Every 20th sample is plotted, along with the regression lines (FnVF (t)=0.67 L(t)+13.2 N, Fnth=0.68 L(t) + 9.4 N). The correlation coefficient between the forces = 0.9991, regression between the forces: Fnth(t)=1.01 FnVF(t) − 3.88N. Mean and standard deviation of the difference were 3.73 ± 0.17 N. (b) Mean and standard deviation of average difference (shift) between VF and thumb normal forces by subject (positive signifies the VF force greater than thumb force), sorted from minimum to maximum.

